How to perform Twitter sentiment analysis?
What is Twitter sentiment analysis?
Twitter sentiment analysis is a real-time automated machine learning technique that identifies and
classifies the subjective context in tweets.
Sentiment analysis of Twitter
data involves opinion mining to analyze positive, negative or neutral psychological
intent in tweets. Subsequently, subsequent textual cues are predicted based on the
patterns identified during text mining.
With an average of approximately
10,033 tweets per second, as reported in May 2022, the growing number of tweets per
day is generating a lot of data.
Twitter sentiment analysis machine learning
uses natural language processing (NLP) classification algorithms to meet the
challenge. Among them are Logistic Regression, Naive Bayes (NB) and Support Vector
Machines (SVM) are well known classifiers.

How to perform Twitter sentiment analysis?
Common steps to perform a Twitter sentiment analysis include:
- Sorting Twitter data
- Cleaning Twitter data
- Developing Twitter sentiment analysis
model
- Analyzing Twitter data for positive/negative sentiment
-
Visualizing insights
1. Sorting Twitter data
The
first step in sentiment analysis is to collect and sort the data. There is a huge
amount of data on Twitter and it is important to choose the data that is most
relevant to the problem you are trying to solve or the thing you are hoping to find.
Only relevant data can be used to train a sentiment analysis model and test whether
the model performs satisfactorily on the Twitter data. Another important aspect to
cover is the type of tweets you want to analyze - historical or current. To sort
this data, you first need to extract it from Twitter. To do this, you can use some
of the following platforms:
- Zapier, for example, creates an automated
workflow between Twitter and Google Forms.
- IFTTT collects Twitter data
without any code.
- Export tweets to track hashtags, keywords, etc. in real
time, or find historical tweets and mentions.
- Tweets download to collect
tweets from your own account, including mentions and replies.
- Twitter API
for accessing and analyzing public tweets about keywords, brand mentions, subject
tags, or tweets from specific people. - Tweepy, a python library for accessing the
Twitter API and collecting data from there.
2. Cleaning Twitter
data
After collecting and sorting the data, it needs to be
cleaned before it can be used to train a Twitter sentiment analysis model. Twitter
data is mostly unstructured, so the cleaning process involves removing emoticons,
special characters, and unnecessary spaces. The process also involves removing
duplicate tweets, formatting, and removing very short tweets - tweets of less than
three characters. Cleaner data provides more accurate results.
3.
Developing Twitter sentiment analysis model
There are different
machine learning platforms available to help people build and implement Twitter
sentiment analysis models. These platforms can provide access to pre-trained or
ready-to-train models. You can use your Twitter data to train these models. To
develop a model, you need to perform the following steps:
- Select the type
of model you want to build. For example, a classifier model that helps classify text
into predefined labels.
- Determine the classification type. In this case,
it will be sentiment analysis.
- Import relevant Twitter data to train the
model.
- Label the data as positive, negative or neutral. For example, to
train your model.
- Test your model.
4. Analyzing Twitter
data for positive/negative sentiment
Once your model has been
trained and gives satisfactory test results, it is ready for deployment. Now, you
just need to connect your Twitter data to your sentiment analysis model. There are
several ways to do it. One way is to analyze specific files of new or invisible
tweets and classify them. Another way is to integrate Twitter data with Zapier and
Google Tables and use your model to analyze this data.
5.
Visualizing insights
There are tools that can help visualize
your data results and make them easy to interpret and digest. These attractive
visualization tools, such as Google Data Studio, Looker, Tableau, etc., create
visual reports, including charts, graphs, and data tables, that are easily
understood by a wider audience.
Visualization of results
Sentiment analysis exposes
the data obtained by generating KPI results through graphs. There are two distinct
approaches to visualizing real-time analytics - basic text analytics or geospatial
real-time analytics.
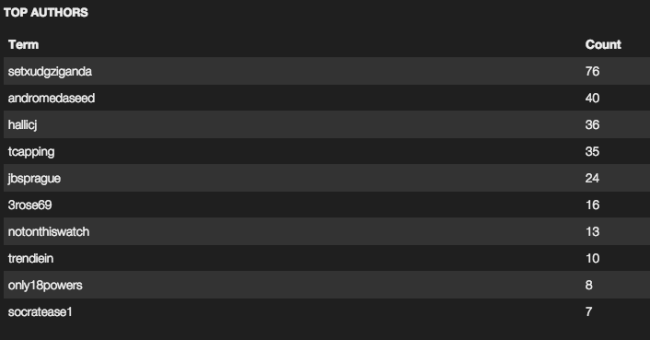
Real-time Basic Text Analysis
Analyzing
text and sentiment ratings in tweets in real time is a challenge because you have to
process and rate the data in a streaming fashion. Generating influencer dashboards
in this use case is also basic, as other data points such as "location" and
influencer ranking are not considered here.

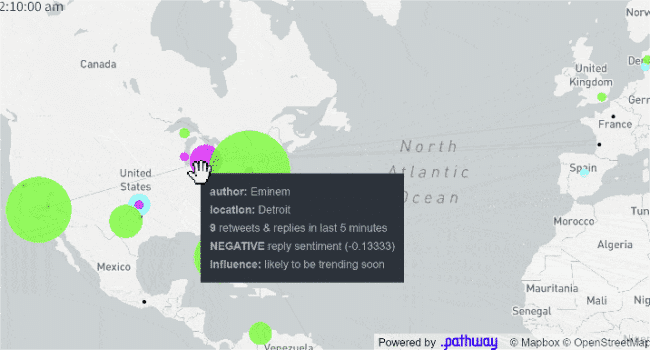
Real-time Geospatial Analytics
For global brands, it's
important to know what's happening globally. Brand reputation can be managed through
regional representation and communication protocols, with a focus on customer
expectations. Understanding "outbreaks" and trends in a Google-like mapping
interface makes it easy to understand how different customers in different regions
and cultures are interpreting events. This can quickly become very complex as you
deal with streaming data (text and geospatial data), machine learning and reactive
dashboards.
